Coding the Task in Python
We will generate n=10000 data points following the true normal distribution $\mathcal{N}(2, 1)$. Then, we will start from a random guess mu = -1.0 and update it using the update equation above.
# Import relevant libraries
import math
import numpy as np
import matplotlib.pyplot as plt
import scipy.stats as stats

# Generate data
n = 10000
mu_true = 2.0
x = np.random.normal(loc=mu_true, scale=1.0, size=n)

# Algorithm Settings
mu = -1.0        # Start from -1.0
gamma = 0.1      # Learning rate
n_iter = 100     # Number of iterations

# Loop through and update mu
mus = [mu]
for i in range(n_iter):
    mu = mu + gamma*(np.mean(x) - mu)
    mus.append(mu)

# Trajectory of mu
fig, ax = plt.subplots(figsize=(20, 10))
ax.plot(range(n_iter+1), mus, lw=3)
ax.hlines(y=mu_true, xmin=0, xmax=n_iter,
          color='darkred', linestyle='dashed', lw=3)
ax.legend([r'$\mu_t$' + " Trajectory", r'$\mu_{true}$'], prop={'size': 29})
plt.show()
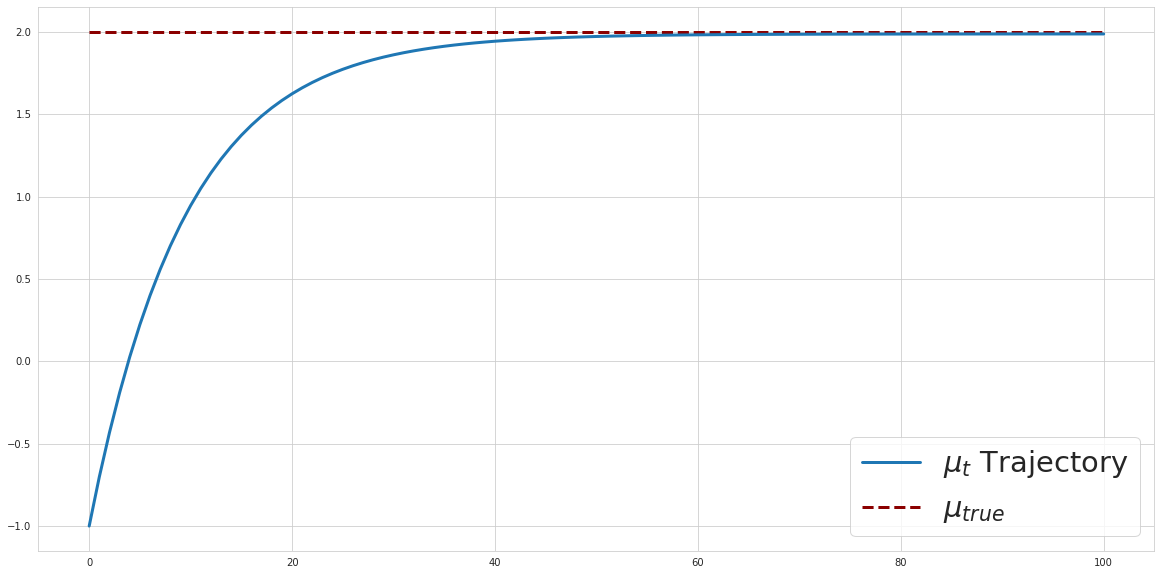
We can see that our algorithm reaches the correct answer. You can run the code above in the associated Google Colab notebook.